

Foreword
When talking about trading or investing, selecting the correct time frame(s) for your strategy is extremely crucial. It will be easy for you to lose some of your profit or even make some losses when you have selected the wrong time frames.
To choose the right ones, you are to think of several questions. For example, what your strategy is, what do you want to know from the charts, and more. In this article, I will provide you some suggestions for choosing timeframes.
What is Time Frame?
Before talking about choosing the correct time frames, we are to know what a time frame is. A time frame of a price chart refers to the duration in time of a single price bar (candlesticks and bar). In other words, how long it takes for a candlestick in your chart to close once it opens. This can be anything from a second to a year or more, depending on the amount of data available.
Often, charts with longer time frames are used by investors to determine and predict long-term price trends. On the contrary, charts with shorter time frames are used by short-term traders to spot short-term price trends and further take action to make profit.
Advice for you when choosing Time Frame
One of the important lessons I have learned about trading is to use things that are commonly used by other traders, for instance, indicators, time frames, and more. The reason for that is it helps you to see the thing that others see. Then, you could take further actions to make a profit.
Don’t attempt to use something special when trading. Keep in mind, trend is your friend
Related articles: Commonly used patterns & indicators
Commonly used Time Frame
Which time frame should you use?
The time frames that should be used vary with different trading strategies. Here, I suggested few time frames for day traders, swing traders and long-investors.
Related articles: The three basic trading strategies
(Please noted that they are only suggestions. You should try to find which works the best for you)
a. Day Trading
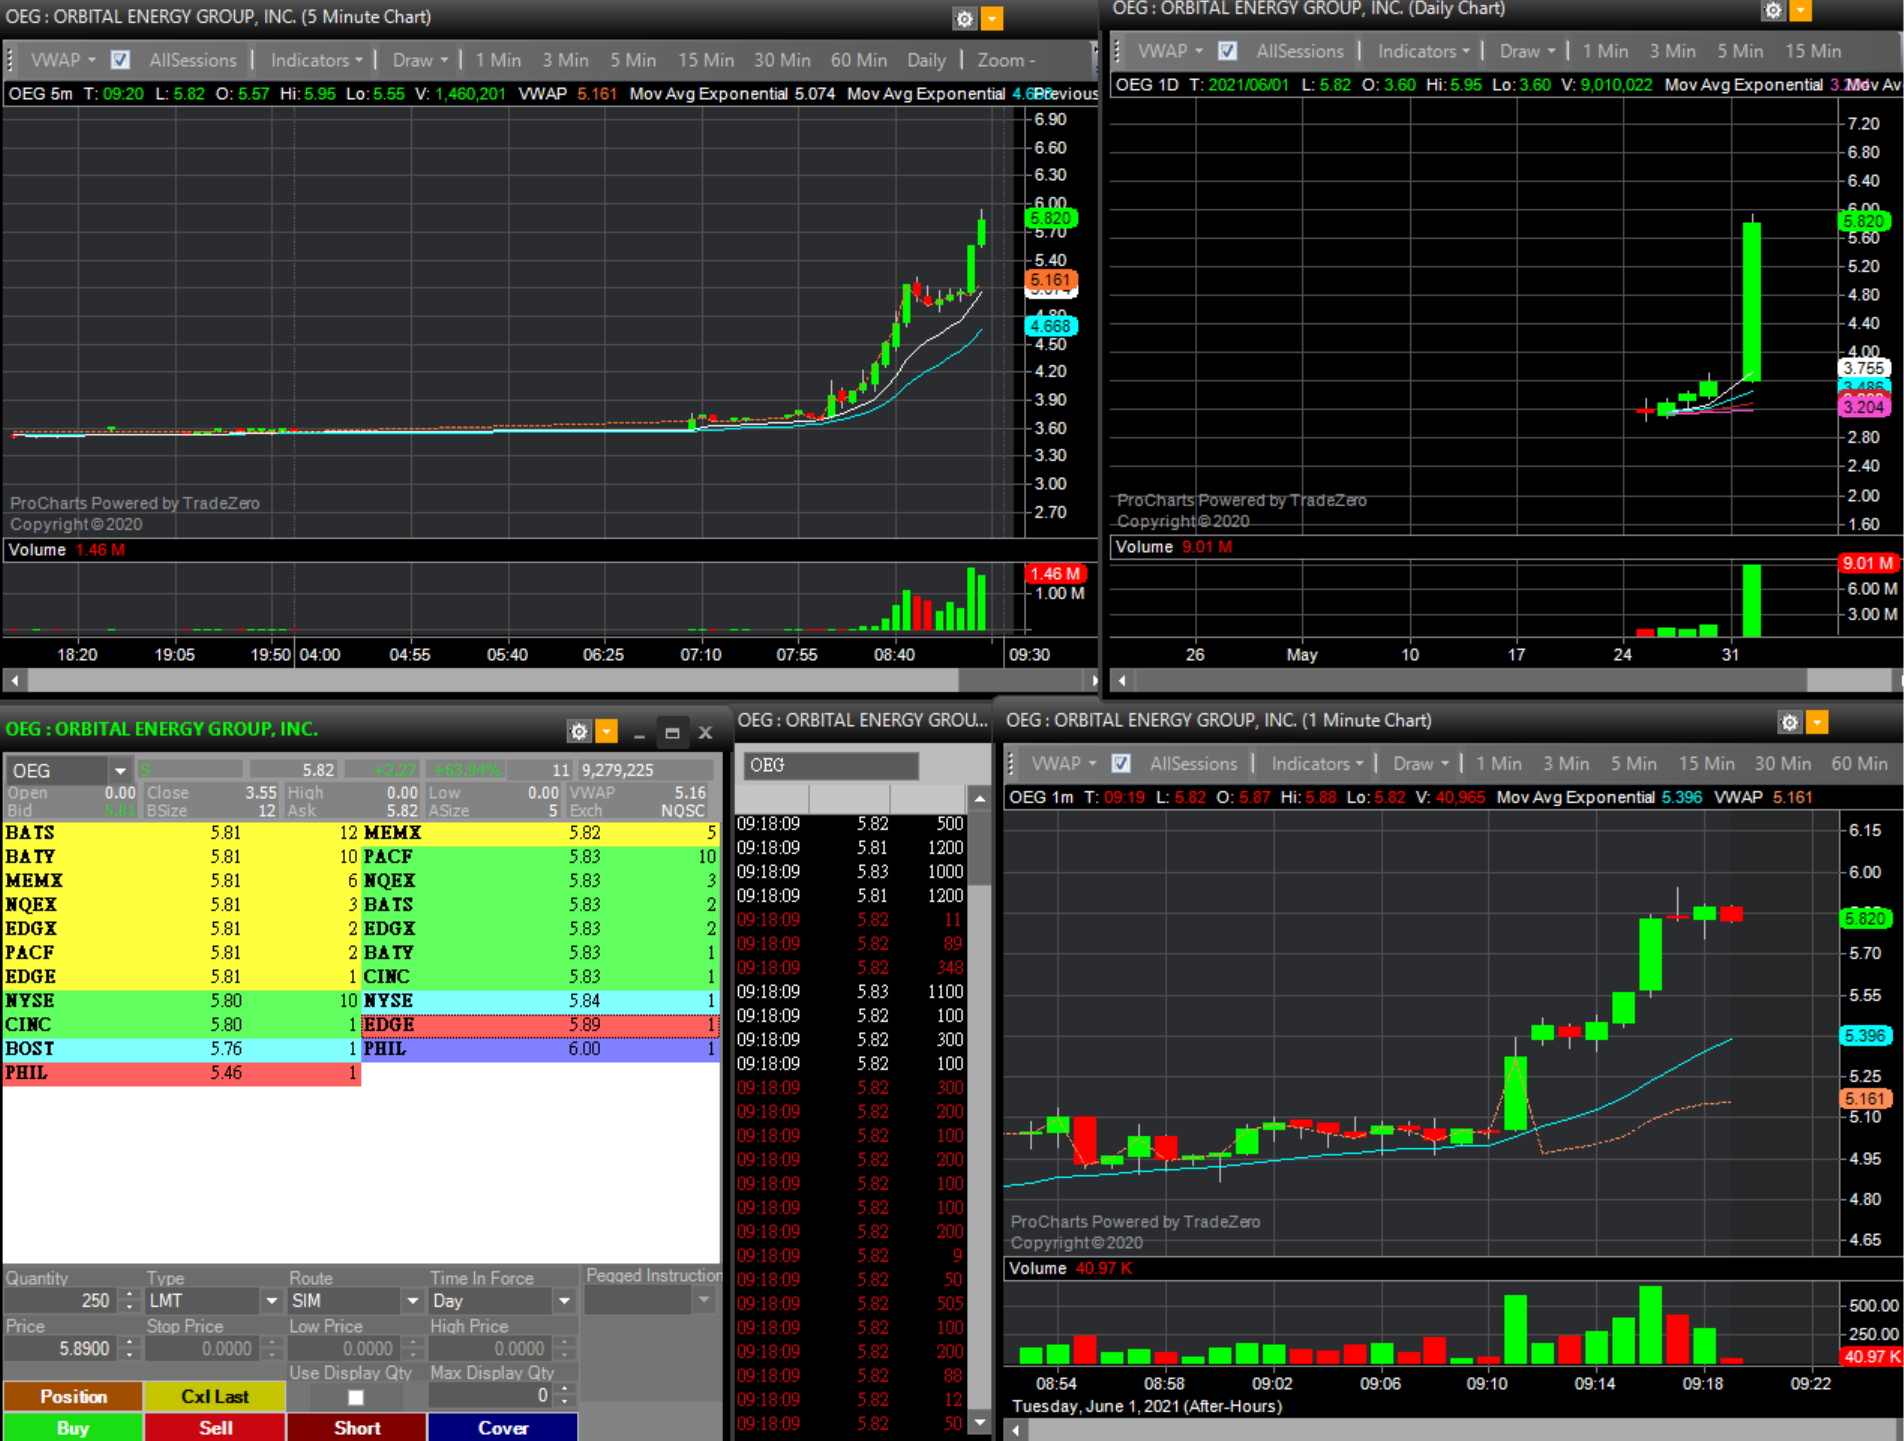
As a day trader, the most important things you need to be aware of when you are trading are the current price action, trend, and market sentiment. There are three charts you may find helpful when you are day trading. They are a 1-min chart, 5 min-chart, and daily chart.
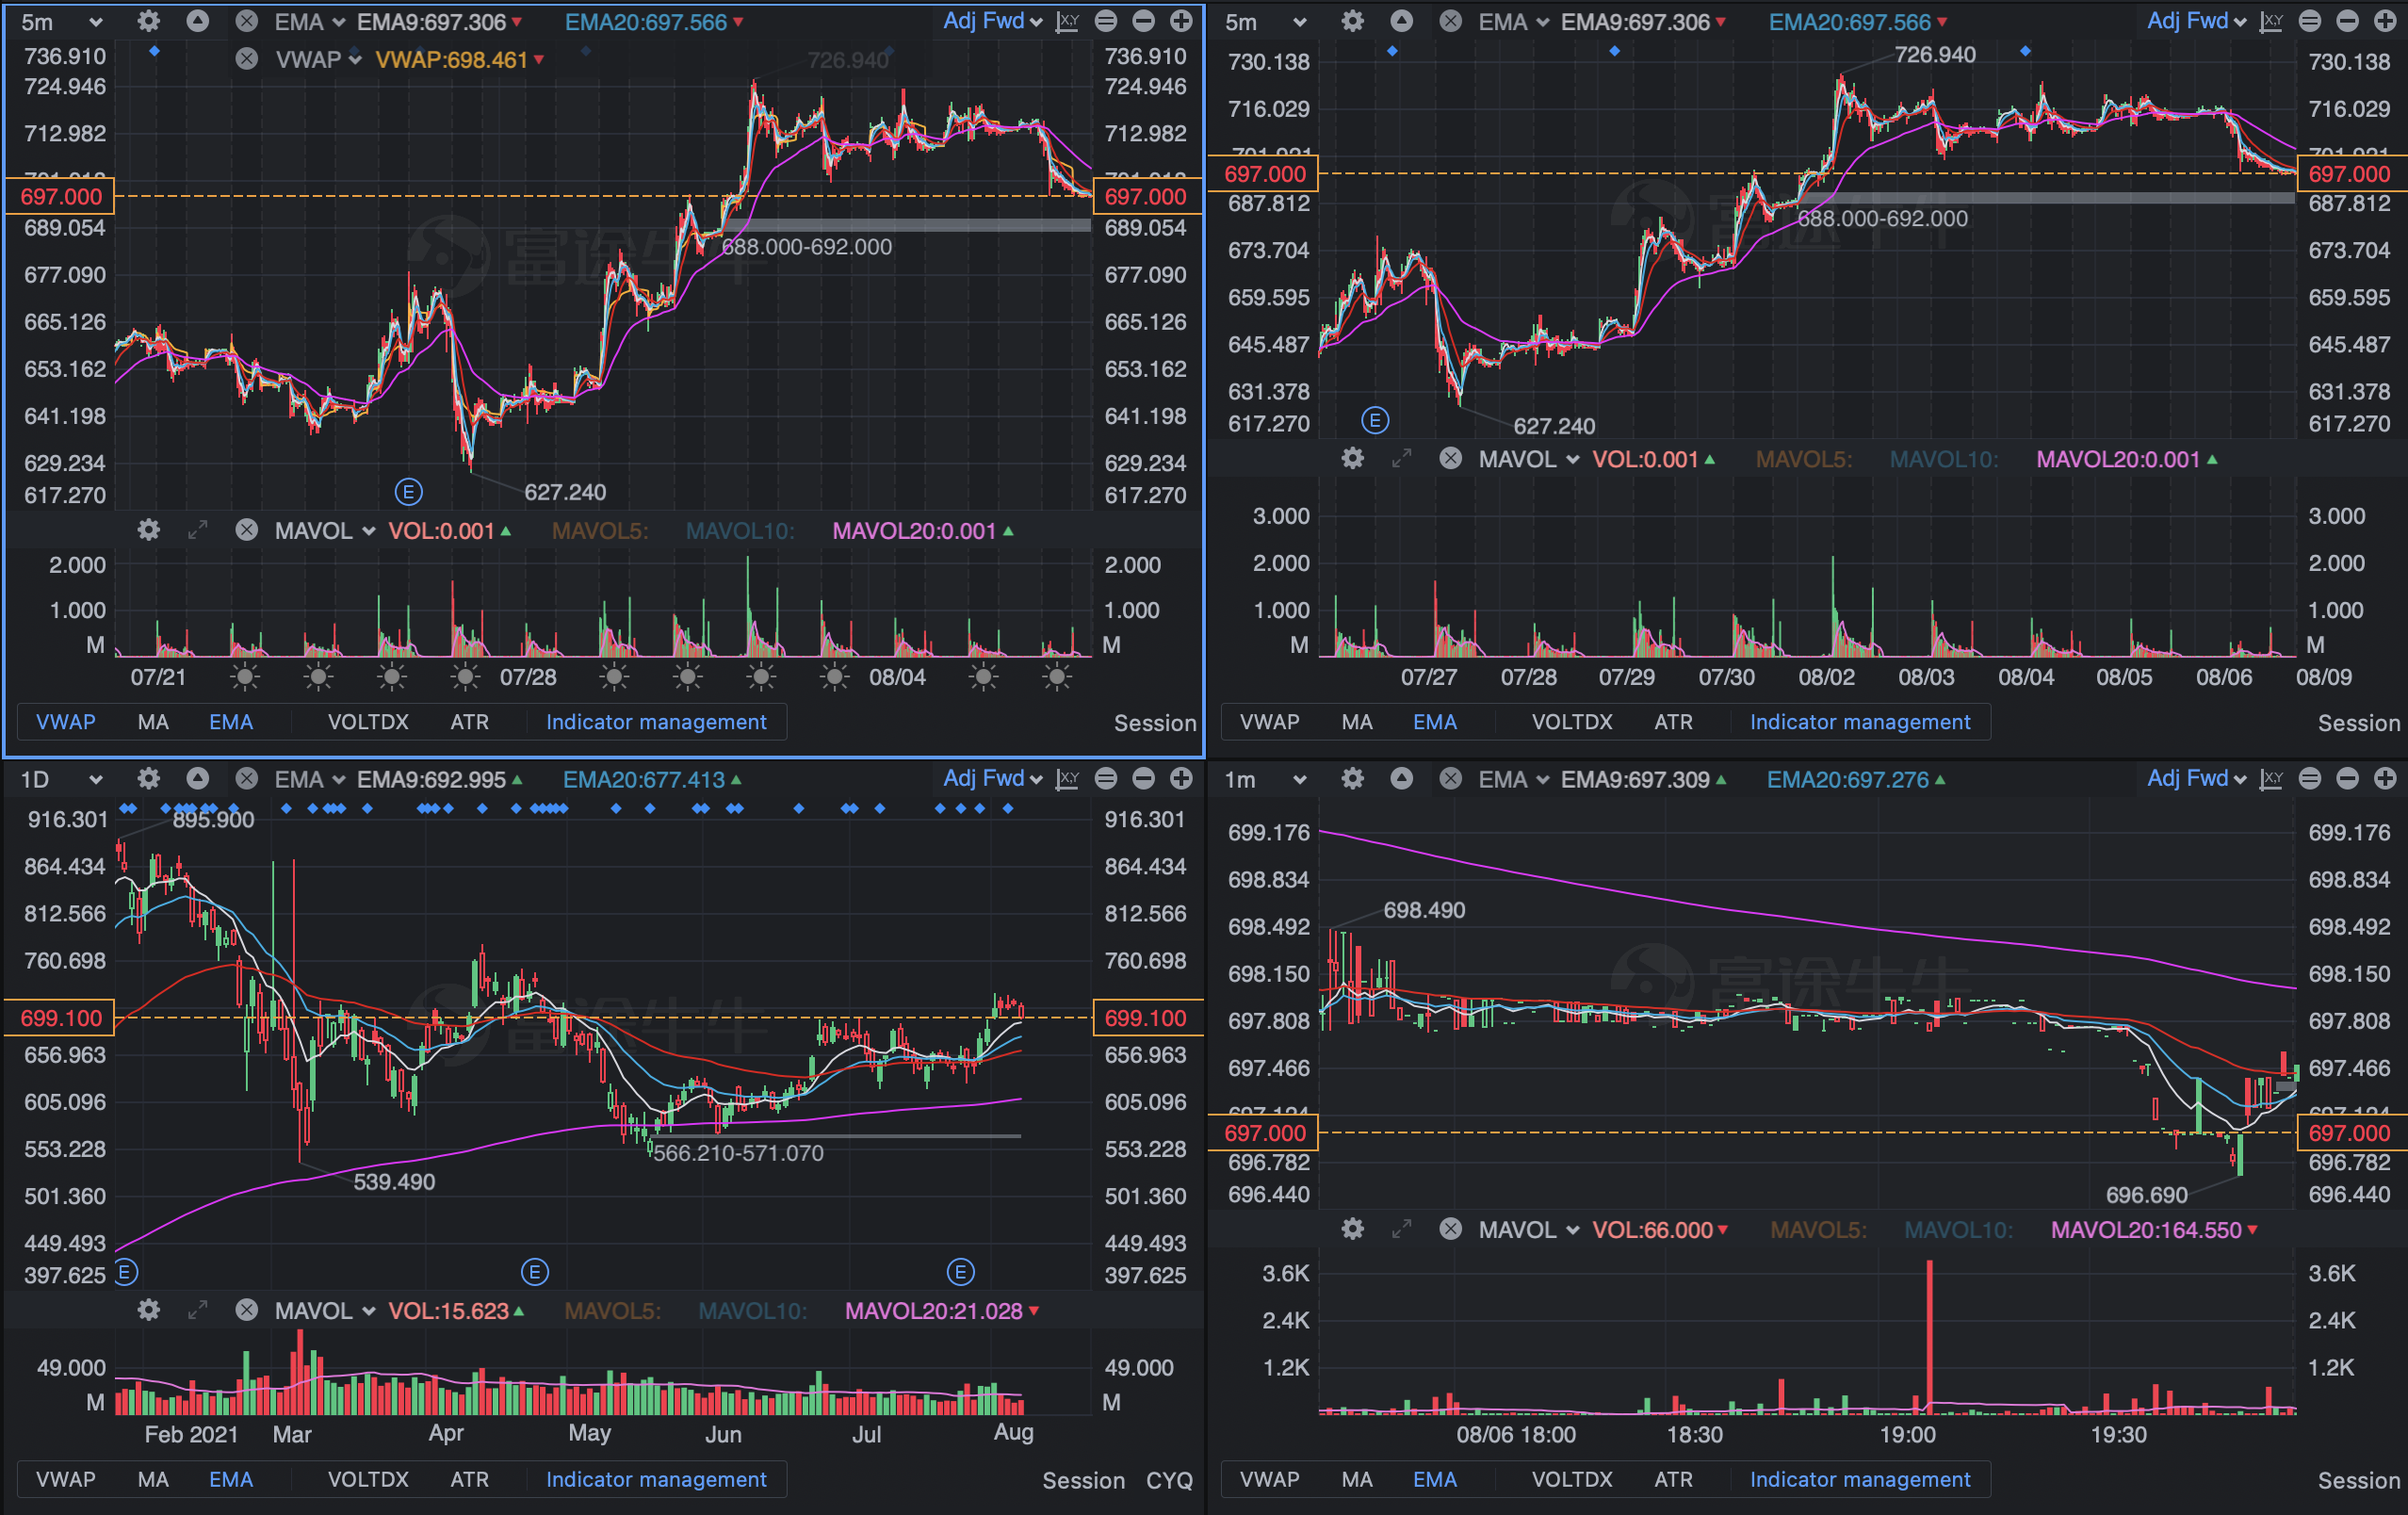
You are suggested using these charts since they could give you up-to-date market data, and you can react to the trend immediately if it turns against you.
| Commonly used Time frame | For What? |
|---|---|
| 1-min charts | Short-term trend prediction + spotting (For Long /Short) |
| 5-min charts | Short-term trend prediction + spotting (For Long /Short) |
| Daily Charts | Support & Resistance line drawing |
(I will explain more in later articles)
There is also a 20-second chart provided by some charting software. You can also use it to make precise decisions when placing orders.
b. Swing Trading
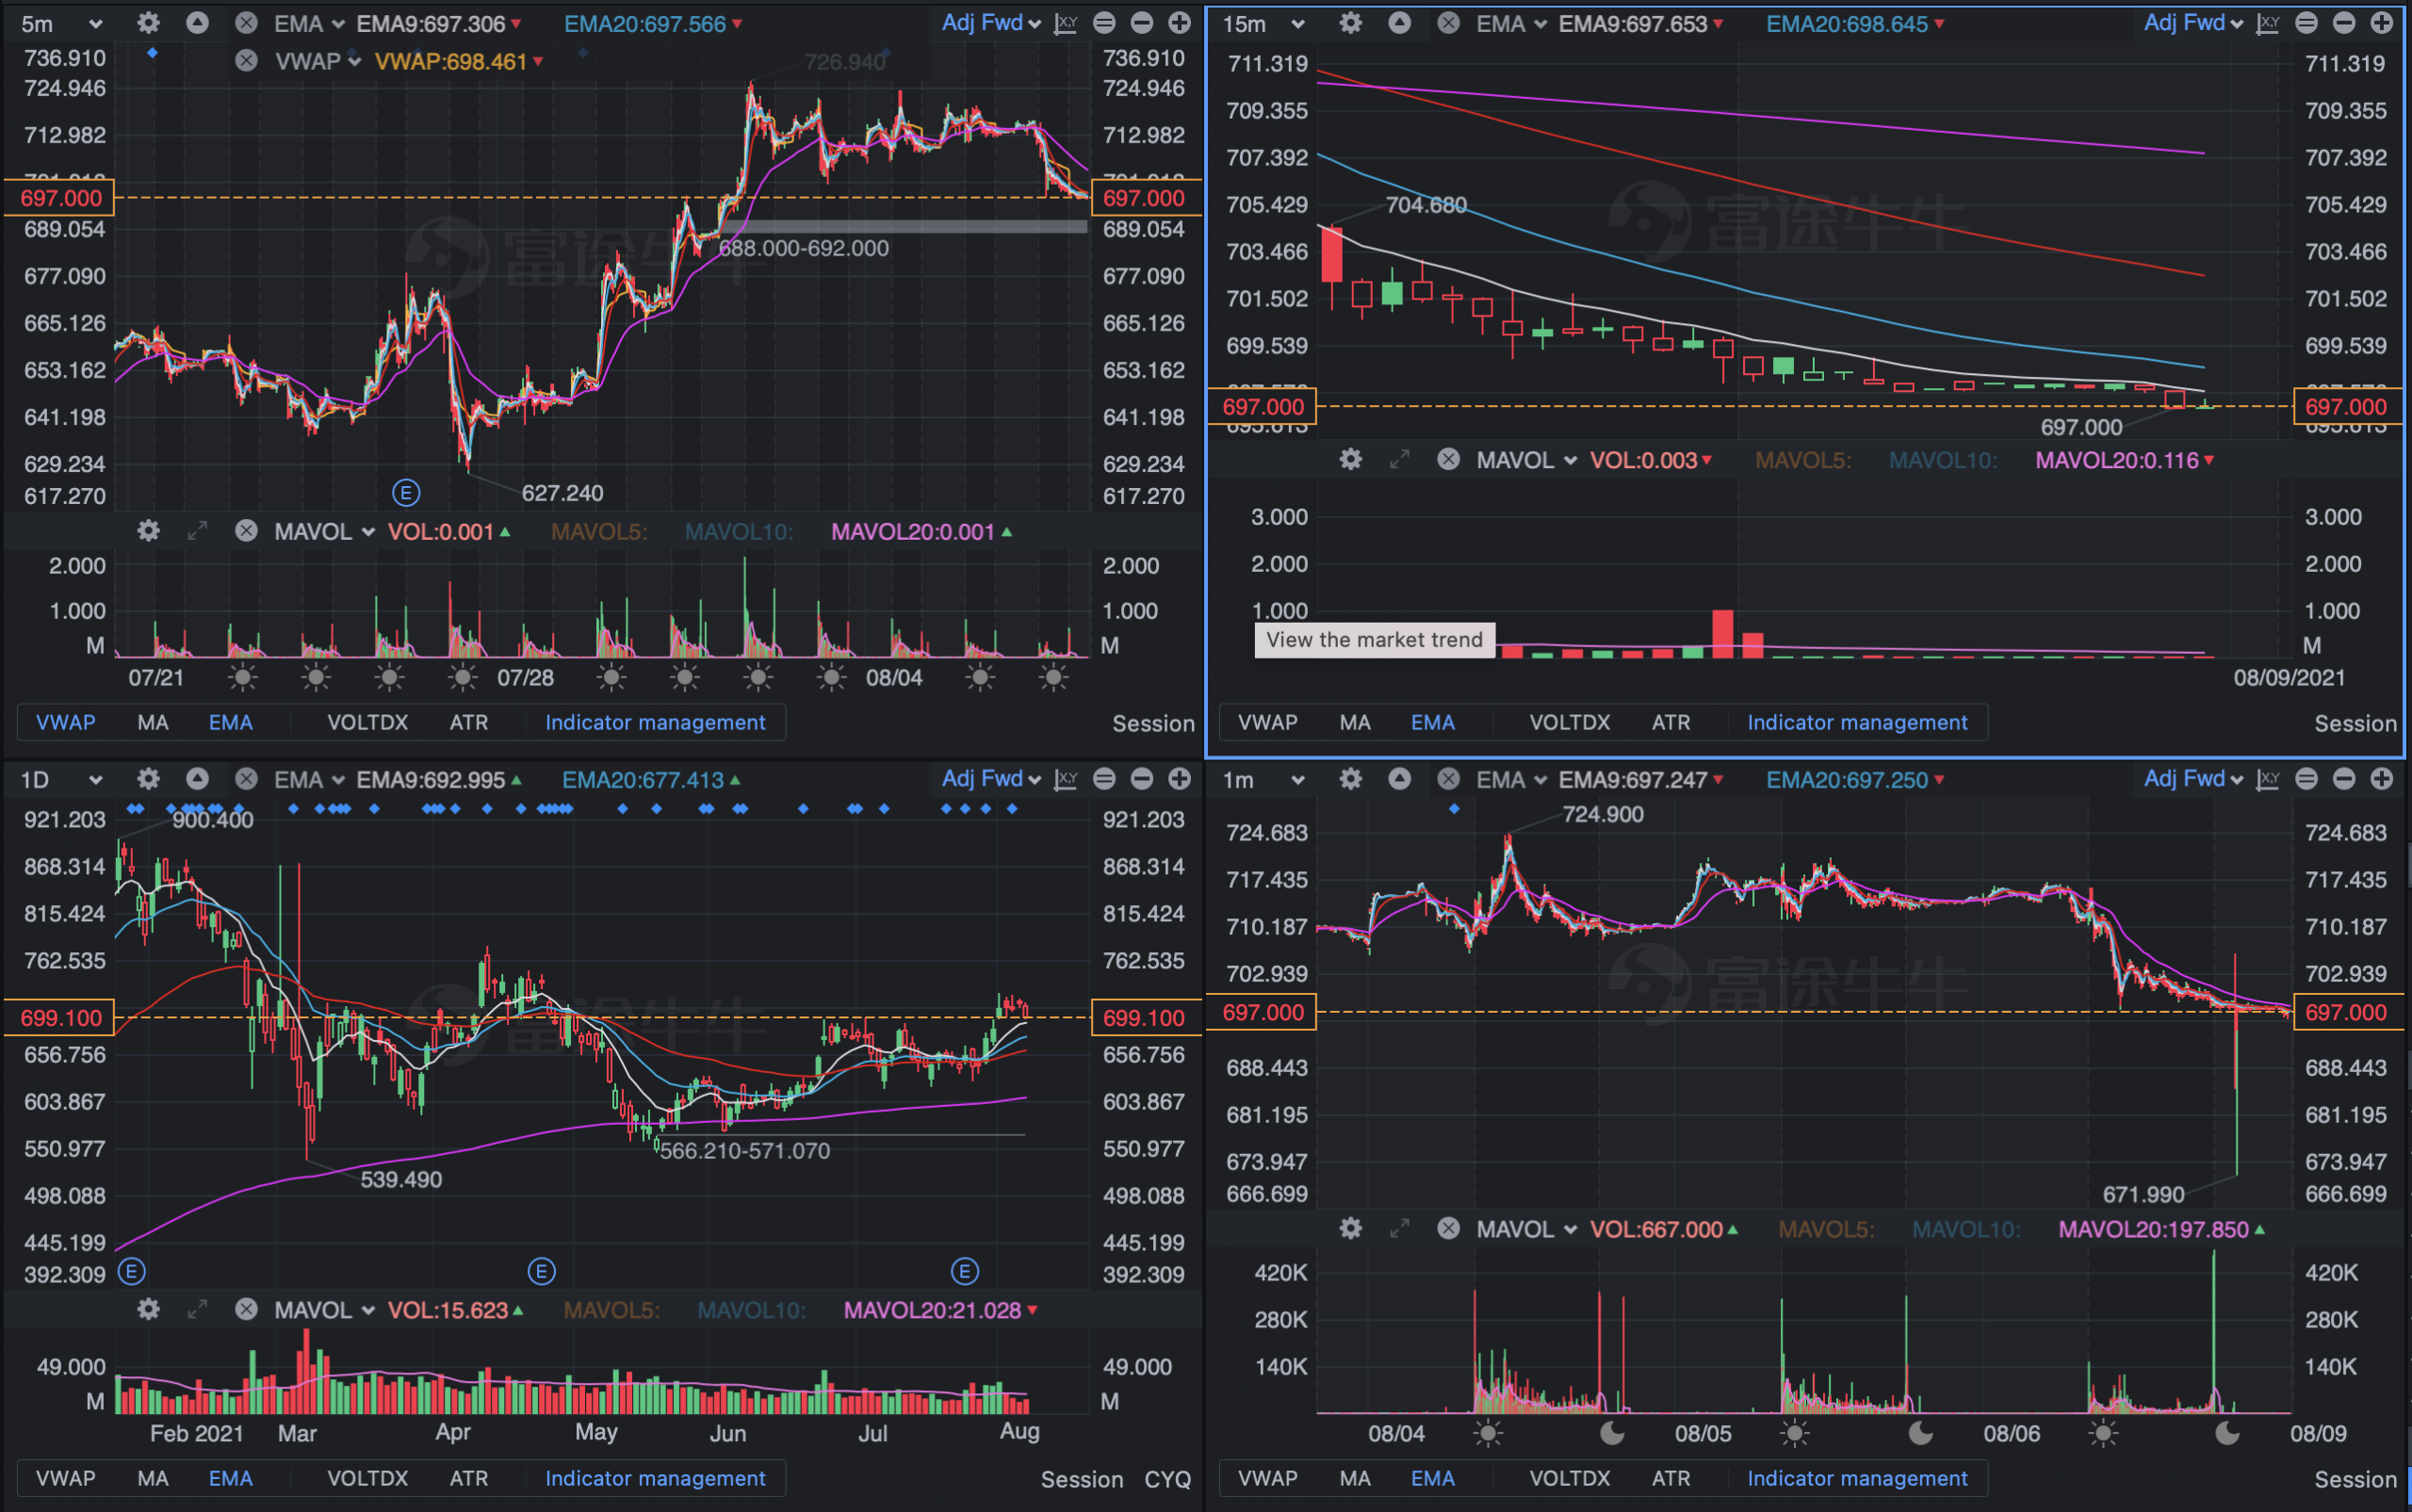
As a swing trader, the most important thing you need to be aware of is the market sentiment. There are four charts you may find helpful when you are swing trading. They are a 1-min chart, 5-min-chart, 1-hour chart, and daily chart.
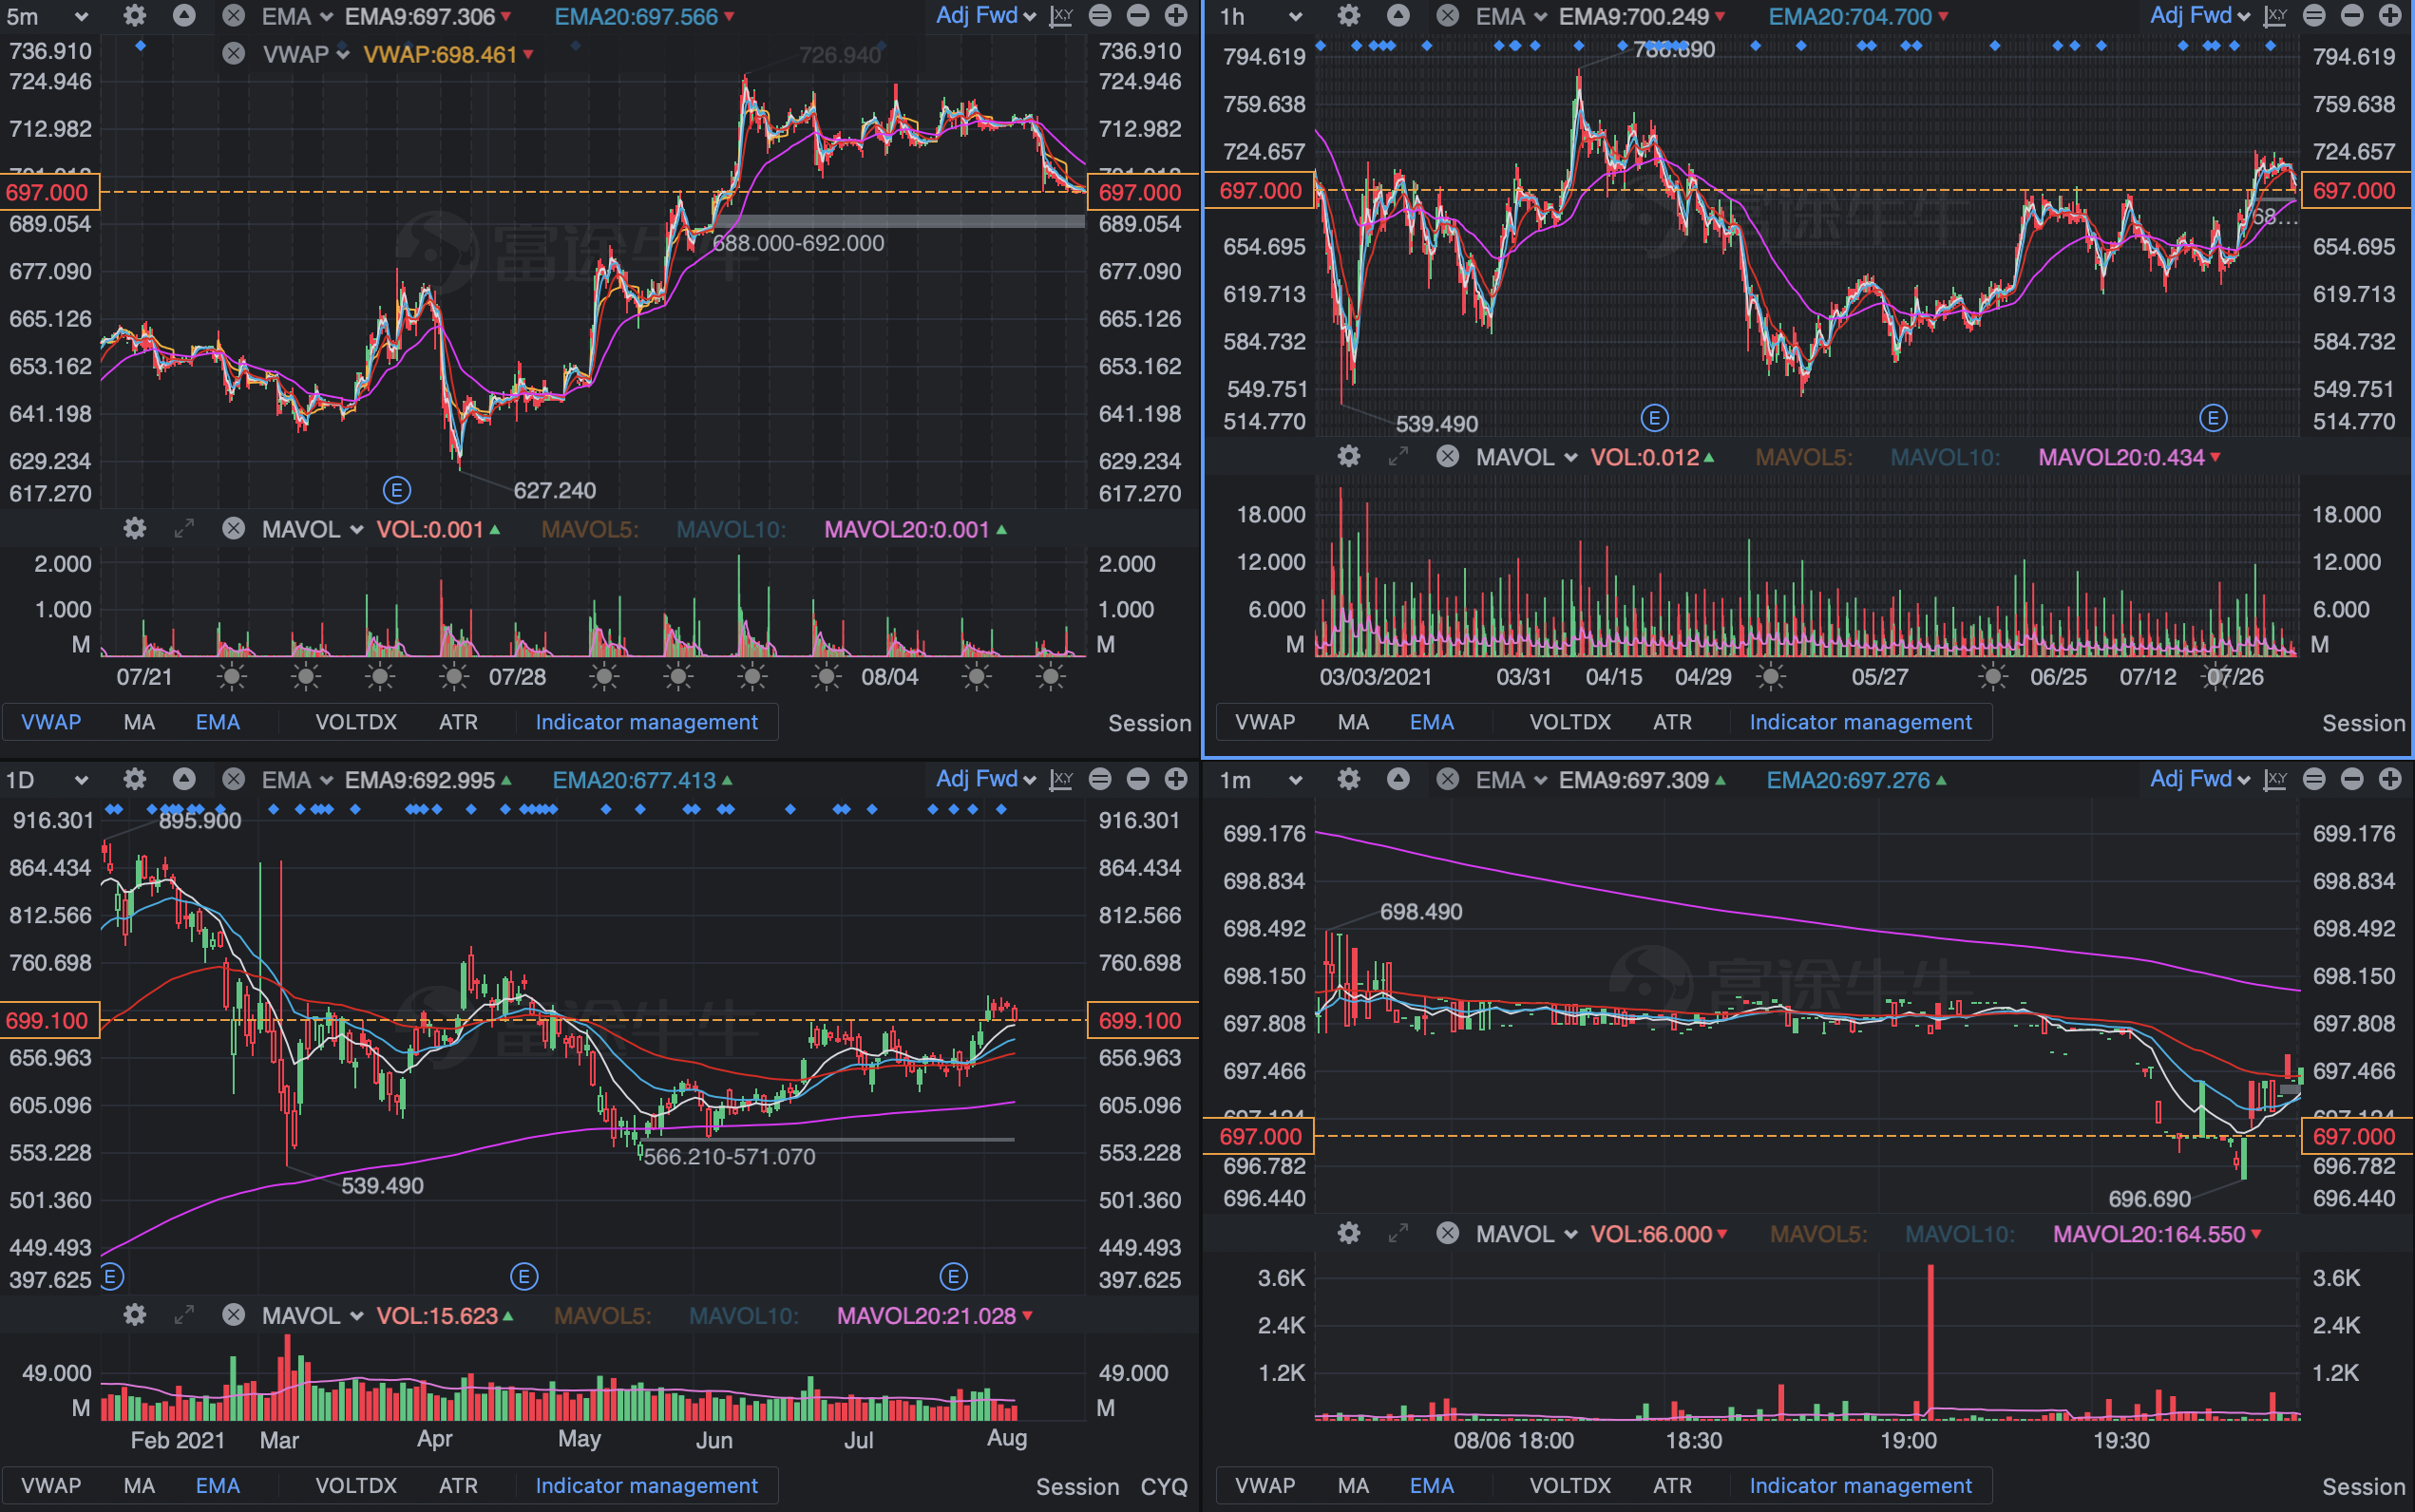
You are suggested using these charts since they allow you to determine whether people are positive to the security or not. And you could close your position immediately if you find your prediction goes wrong.
| Commonly used Time Frame | For What? |
|---|---|
| 1-min charts | Short-term trend prediction + spotting (For Long /Short) |
| 5-min charts | Short-term trend prediction + spotting (For Long /Short) |
| 1- hour charts | Validating their prediction |
| Daily Charts | Support & Resistance line drawing |
c. Long-term investing
Often long-term investors invest in a security base on the growth potential of a company. Therefore, seldom do long-term investors look at short-term charts. 1-Month chart, quarterly chart, and year chart are suggested to be used when you are a long-term investor.
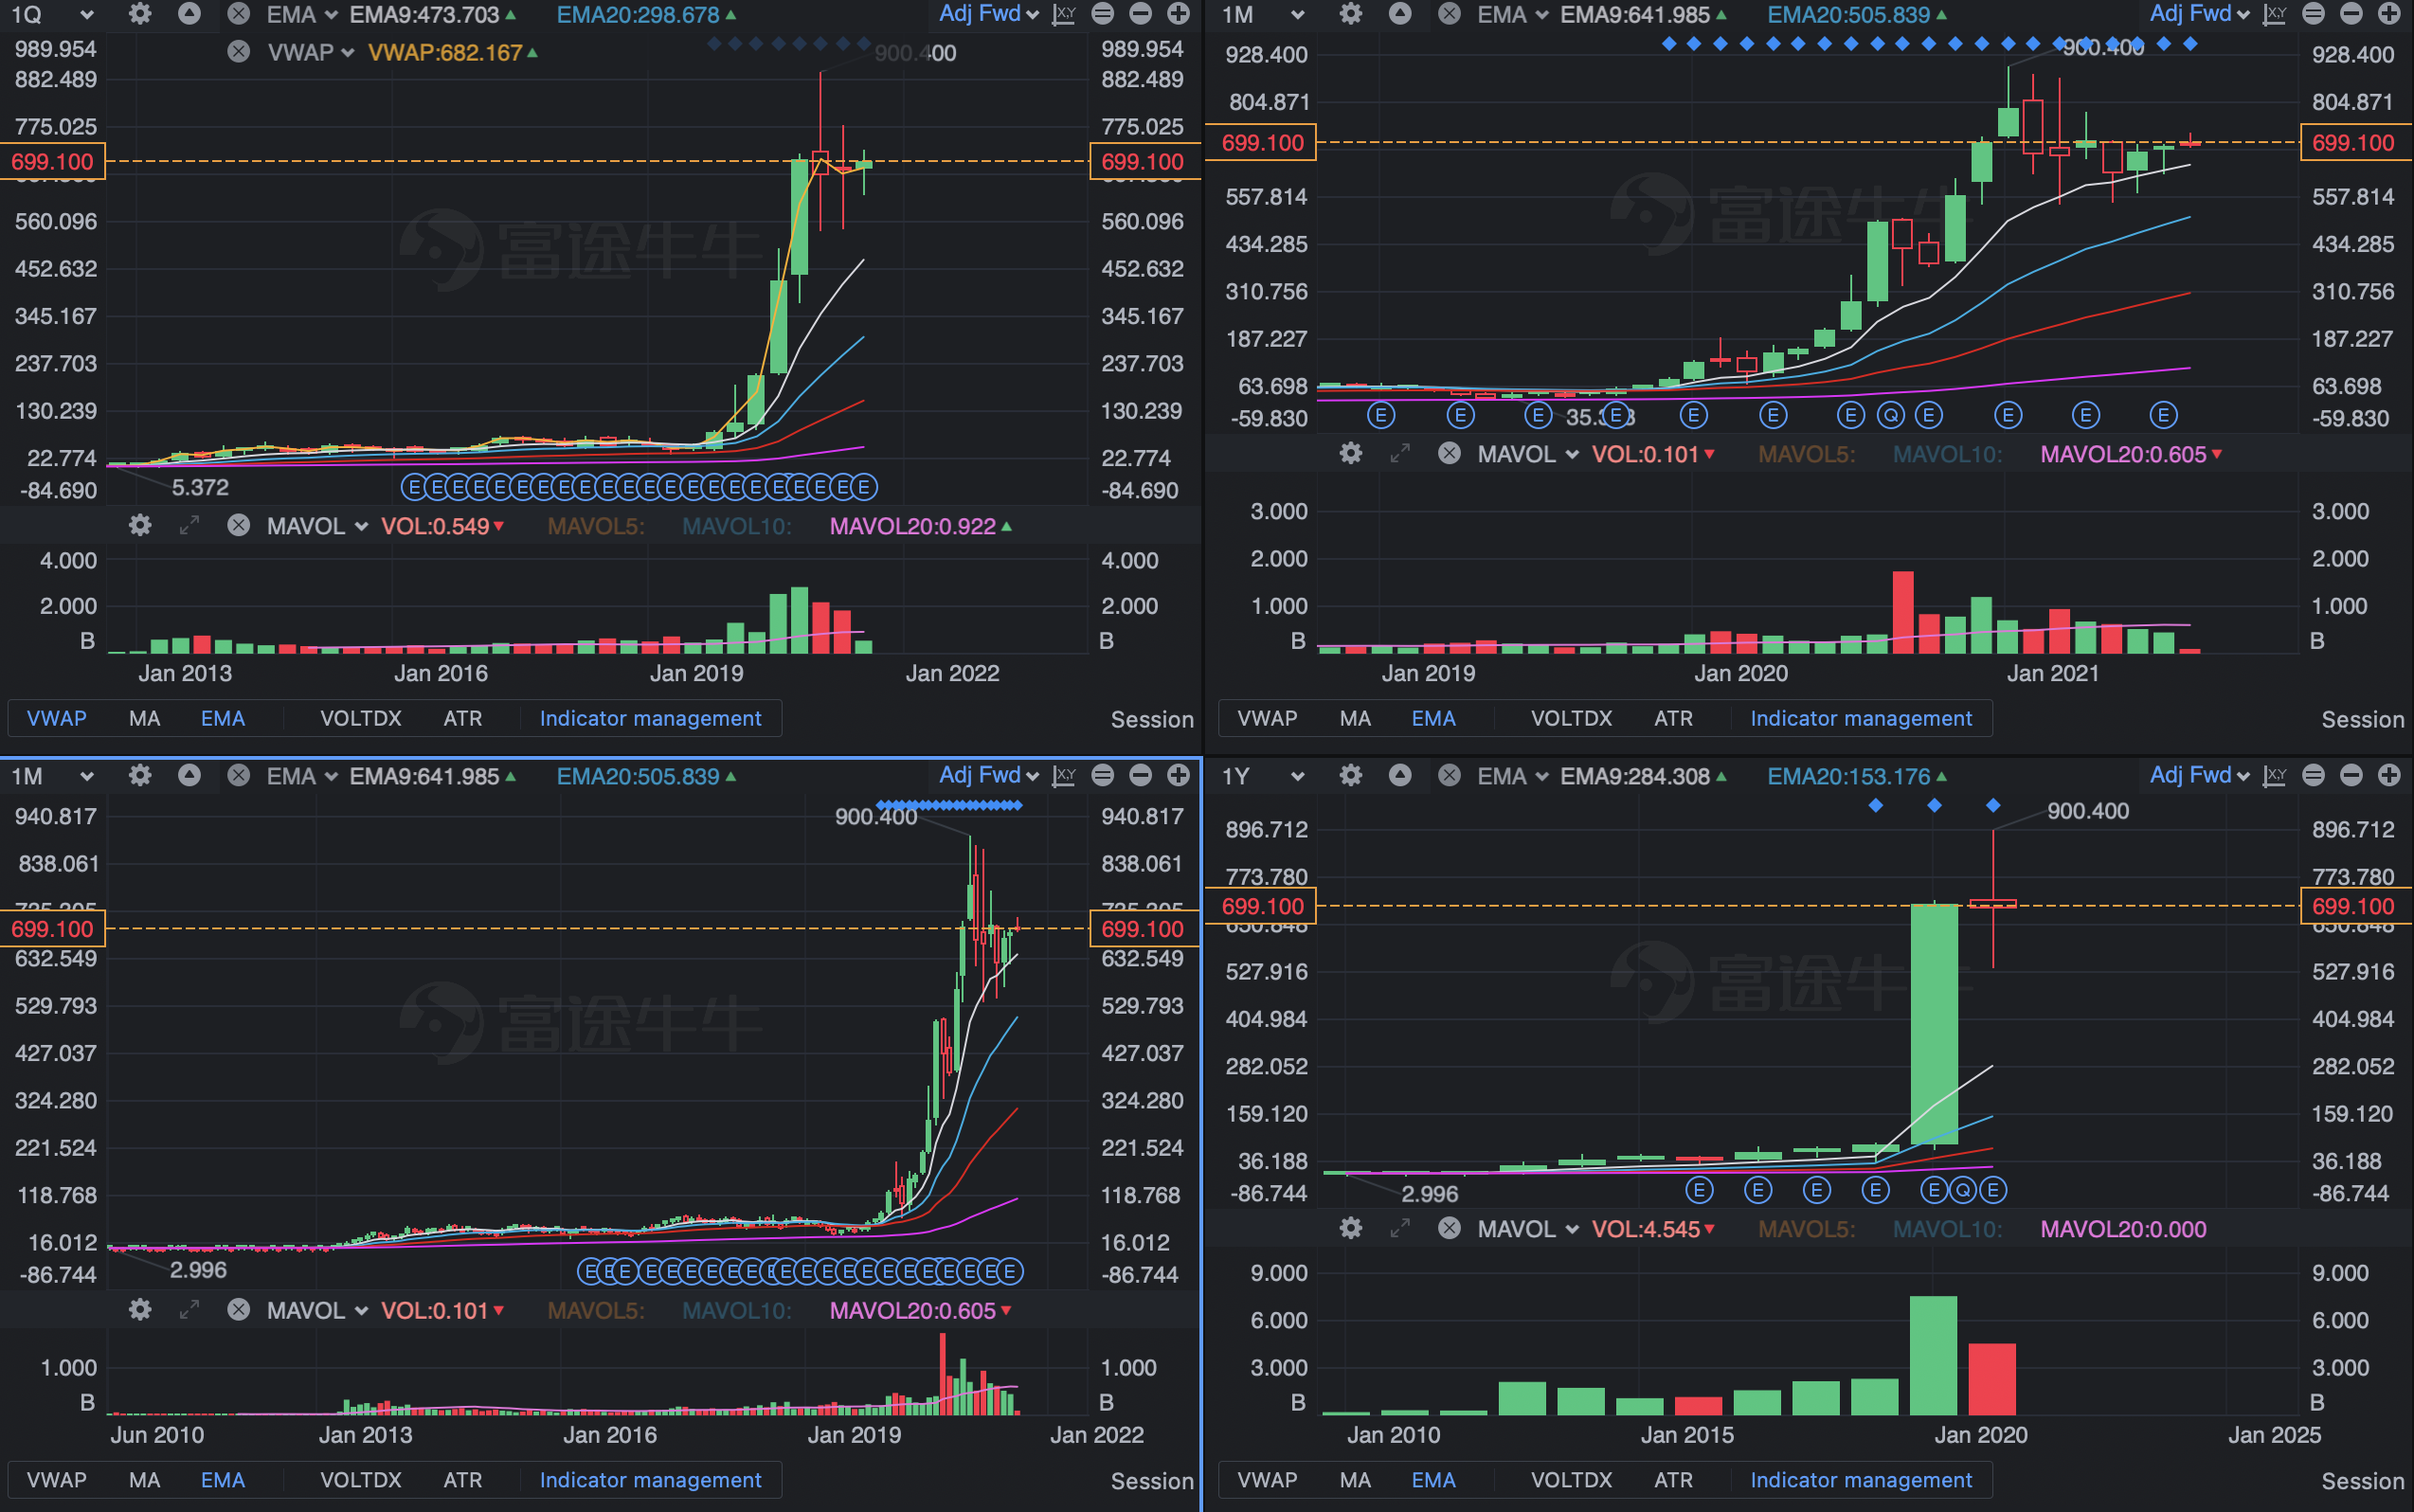
You are suggested using these charts since they allow you to determine whether the security is undervalued or overvalued with the help of different indicators. And you can further invest into those undervalued security to make a profit.
| Commonly used Time Frame | For What? |
|---|---|
| Monthly charts | Spotting Long-term Trends |
| Quarterly charts | Fundamental analysis |
| Yearly charts | Fundamental analysis |
Final Thought
In this article, I have briefly talked about what timeframe is and provide you some suggestions about choosing timeframes. Please keep in mind that there isn’t a model answer for which chart and strategies you should choose. You should try to find which works the best for you.