
Foreword
Do you know what is Volume? Volume is a must-use tool when learning stock trading. It is a powerful tool that helps you to extrapolate whether breakouts occur or not. Acquiring how to utilize Volume allows you to trade with a higher winning percentage.
What is Volume?
Volume is an indicator that shows there is how many trades went through within a timeframe. Often, traders and investors will use this indicator to determine which stock they are trading and when to jump into the market. Volume varies when using the different timeframes such as 1-min charts, 5-min charts, and more.
Where could we find Volume?
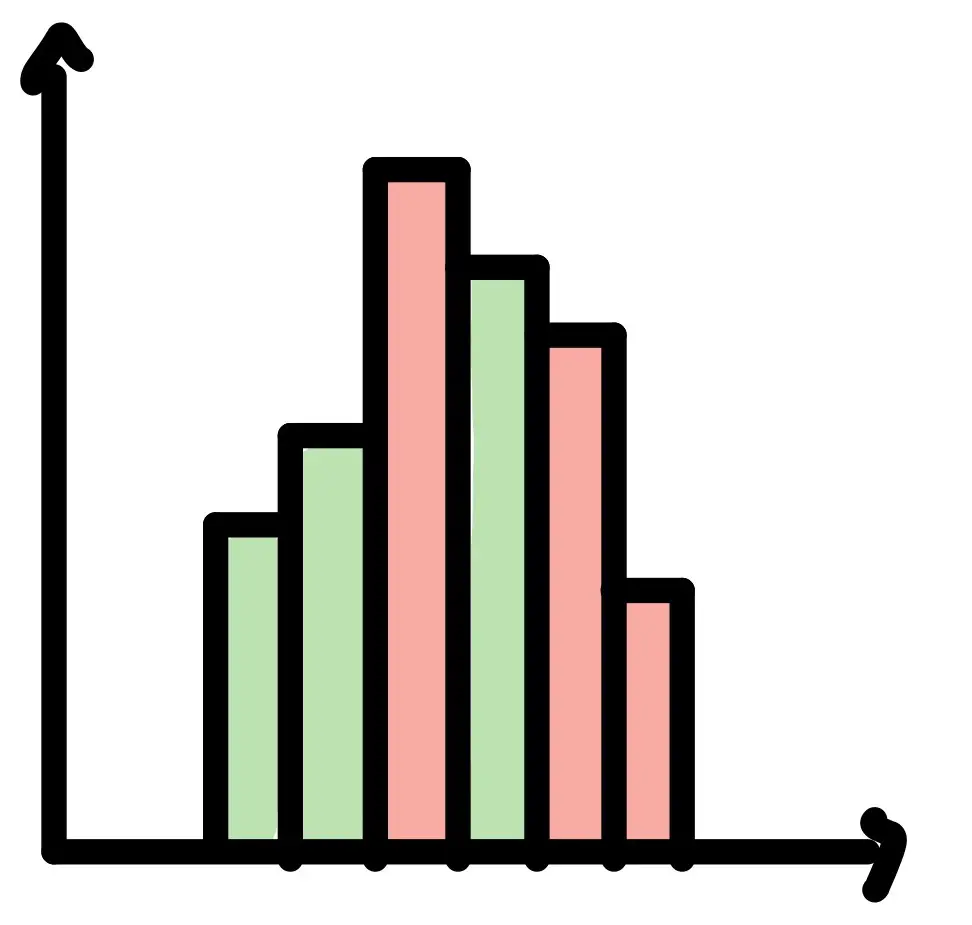
Most of the time, Volume is pre-selected on the chart provided by your broker. They will appear at the bottom of the chart in your trading application. They are either In Green or Red.
(If it does not appear, you could find it in indicators in your charting platform)
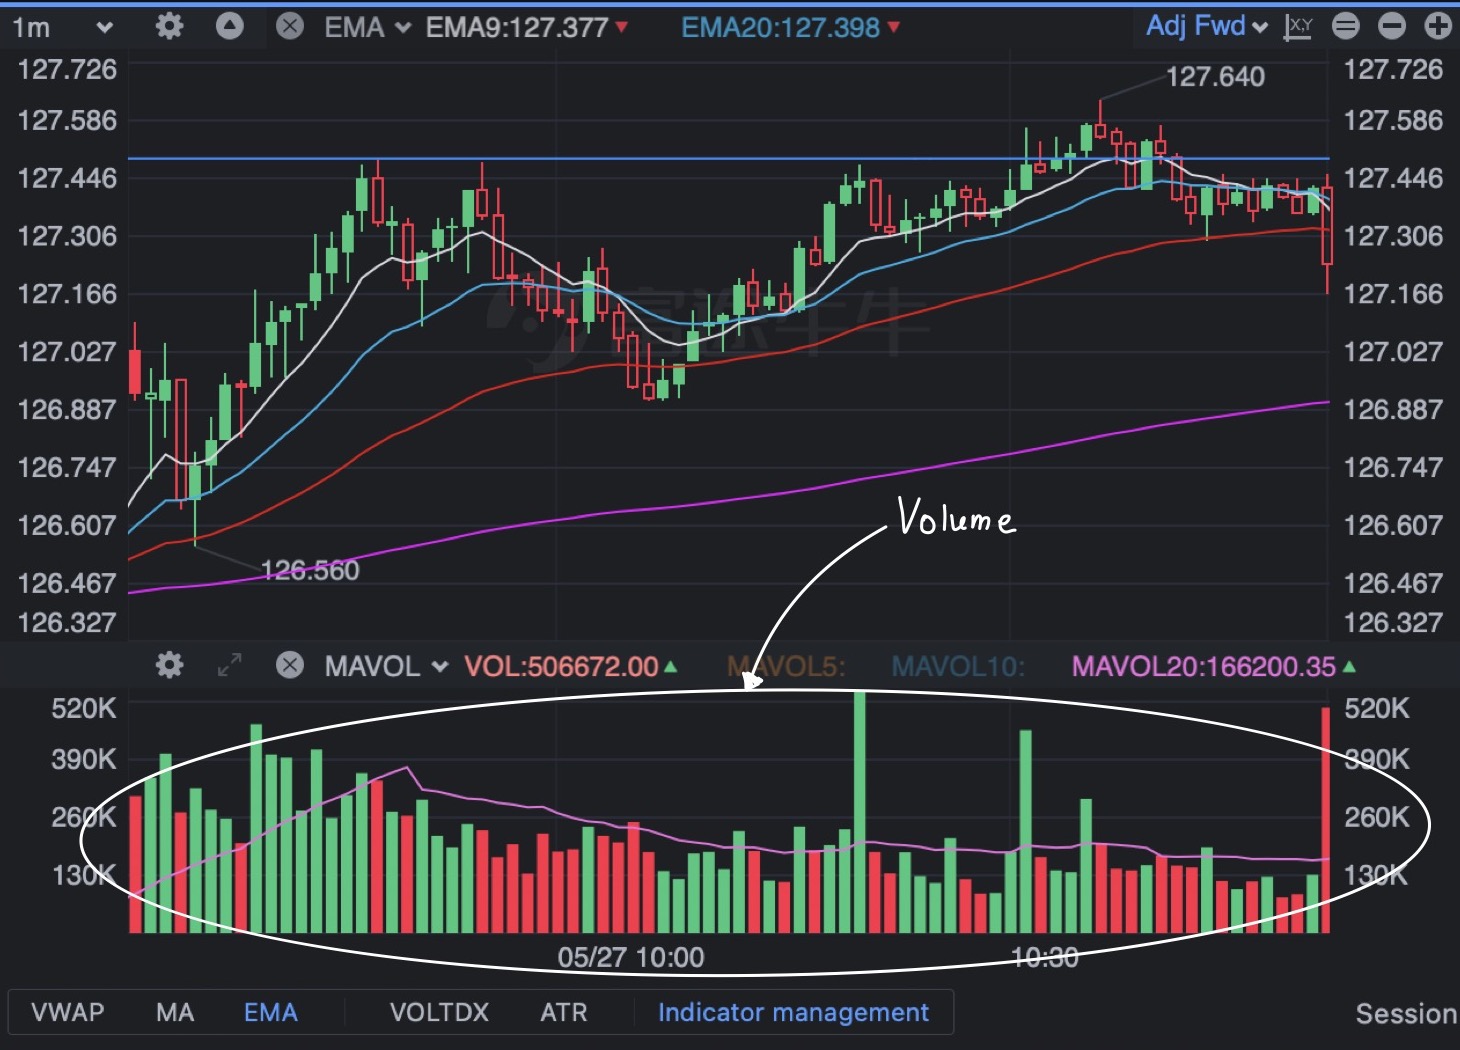
You may probably be curious whether there is something special for the volume bars in either Green or Red. The answer is no. There is nothing special about the color of the volume bars. The only thing it indicates is the price is rising (Green) or falling (Red).
Why we should look at Volume?
| Why we should look at Volume? |
|---|
| 1. Breakout or Fakeout? |
| 2. Strengthen or Weakness? |
| 3. Stock Selection |
| 4. Resistance & Strengthen |
1. Breakout or Fakeout?
When we are looking at the apex point (breakout point) of stock at a price, Volume plays an important when we are extrapolating whether the breakout would occur or not.
(I will explain more how to spot apex point in later articles)
Breakout with significantly increased volume
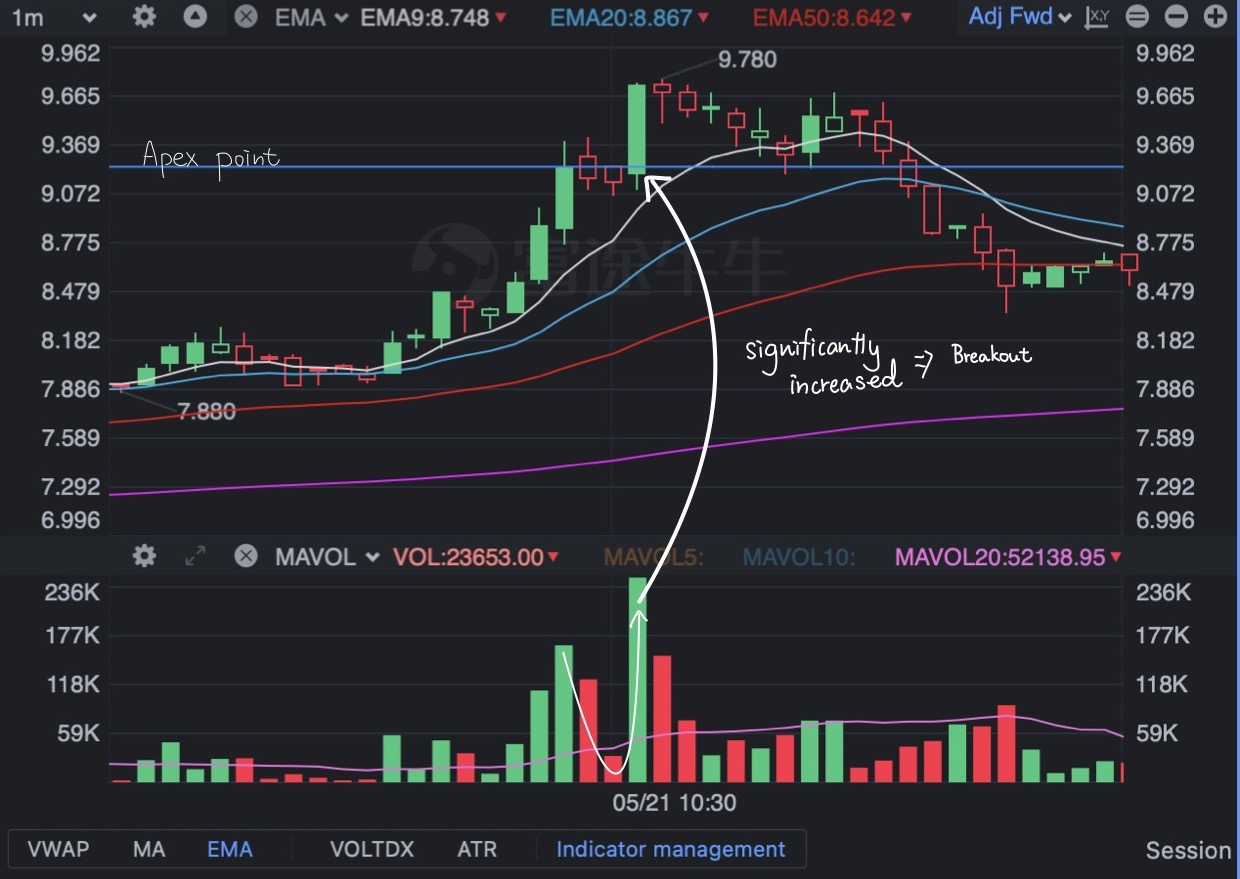
Most of the time, breakouts would occur when the Volume of the specific candle (the one with the apex point) increases significantly in contrast with previous candles.
(Breakout, a term that depicts the stock price continue to rise after it breaks its resistance.)
Fakeout with recently lower volume
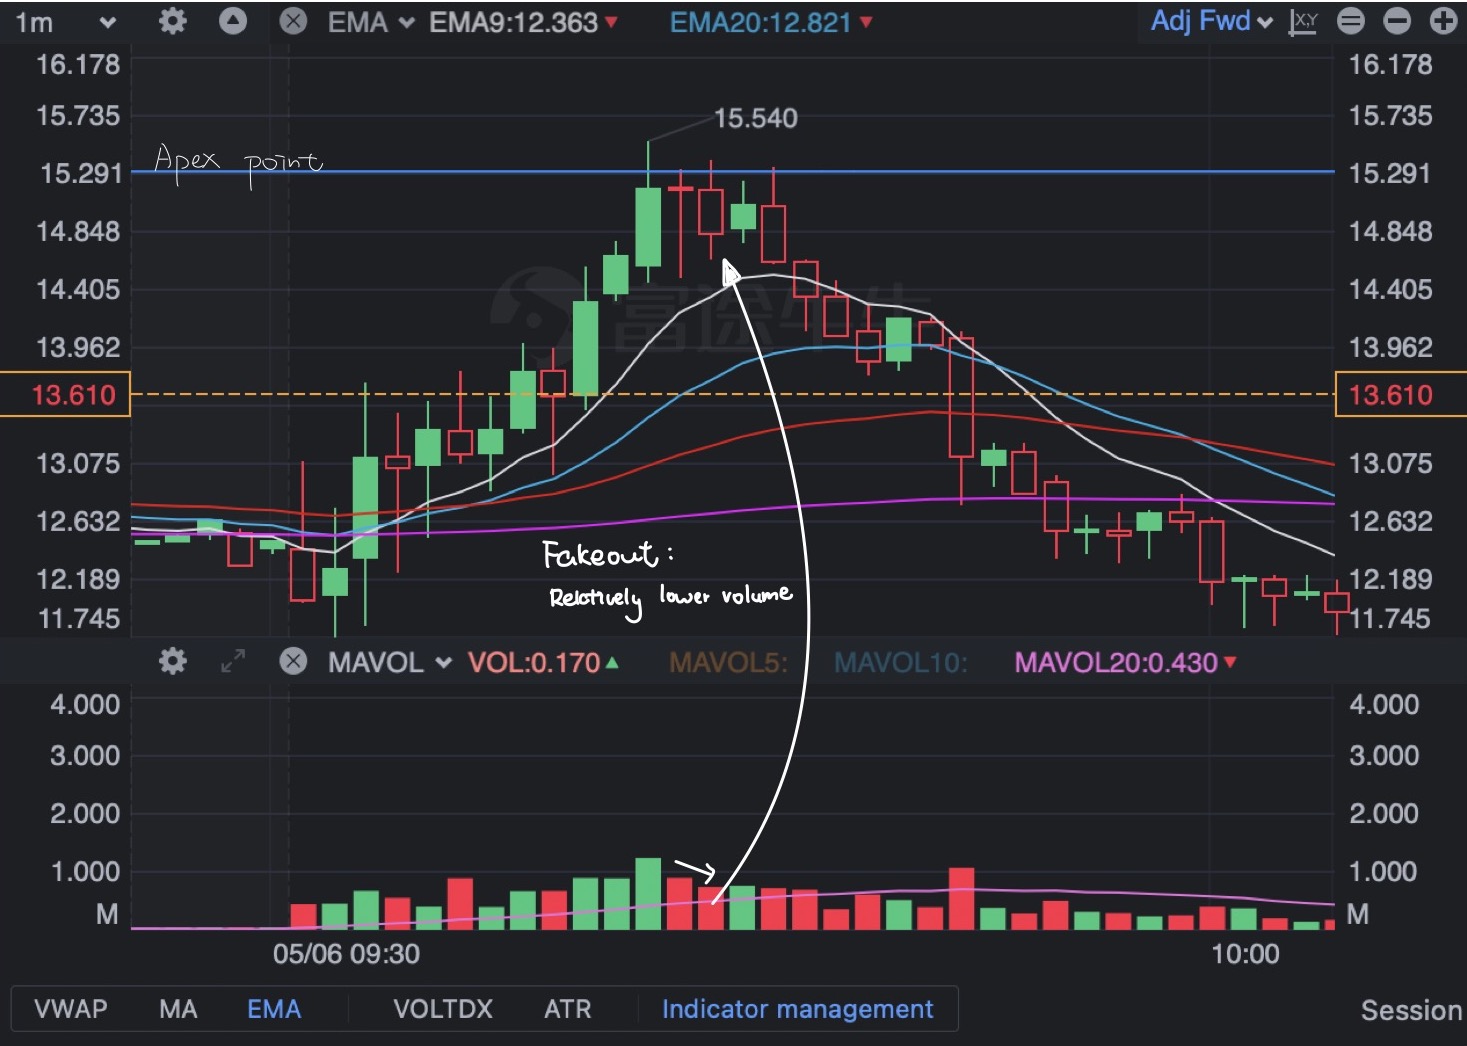
Often, fakeout occurs when there is no significant increase in the volume of a specific candle (the one with the apex point) in contrast with previous candles.
(Fakeout, a term that depicts the stock price suddenly falls and continue dropping after it breaks its resistance.)
How could you predict the Volume of a candle?
You may probably ask how you could predict the Volume of a candle that does not close yet. The answer you cannot. No one knows how many trades will go through in a timeframe. However, you base on the increasing speed of the Volume of the candle to extrapolate whether the stock price would break the resistance and continue to rise or not.
2. Strengthen or Weakness
When finding opportunities to jump into the market, we would like to find out stock that is in strength/weakness. Volume then could show us whether stocks is in play or not.
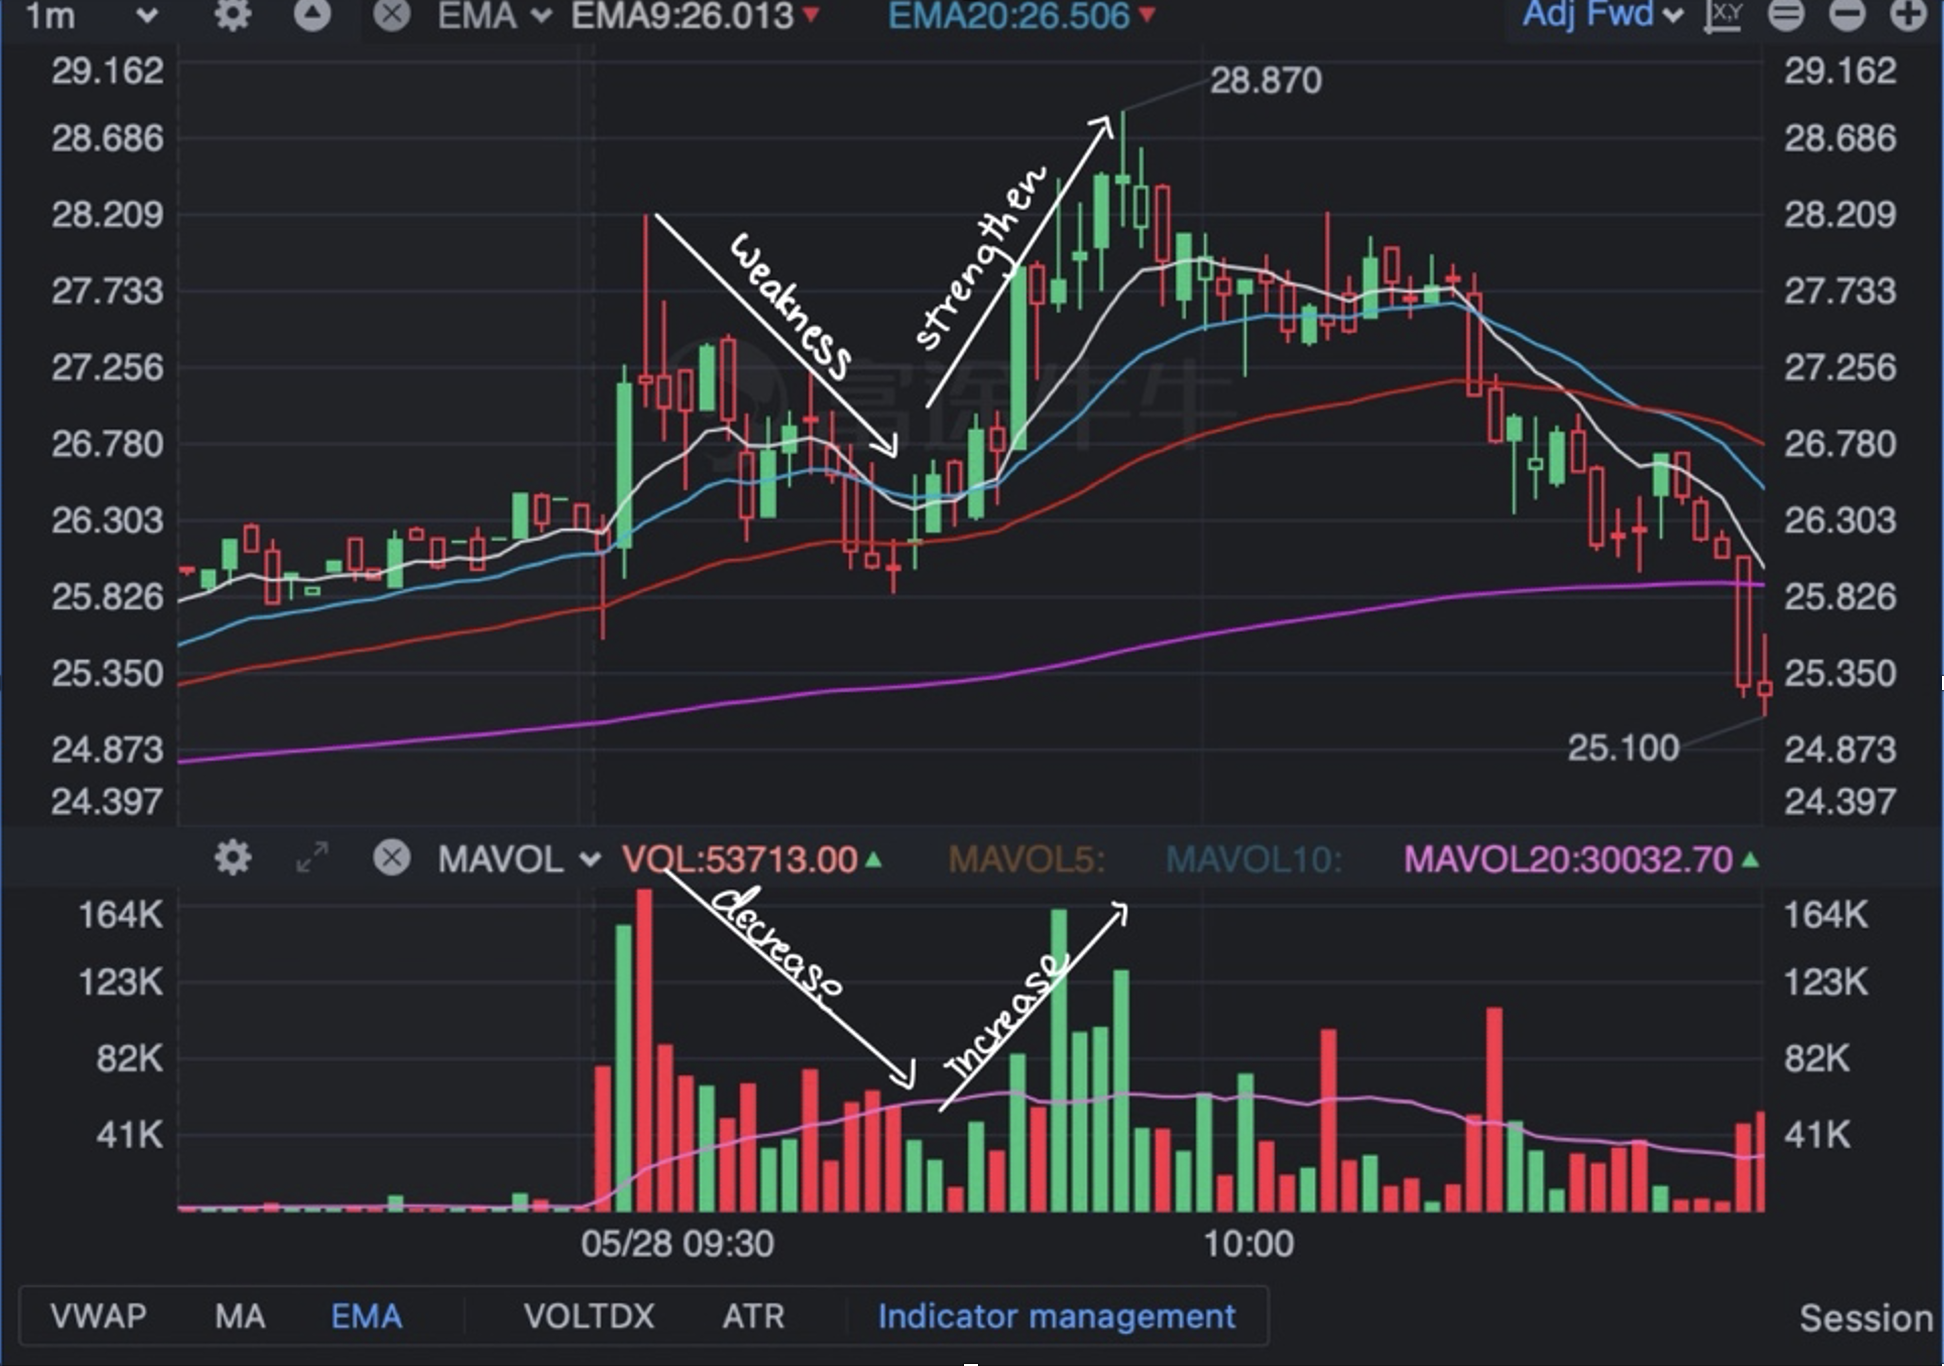
Often, Long buyer will buy stocks when the price is in strength. On the contrary, short sellers will short sell stocks when the price is in weakness.
3. Stock Selection
Volume is also being used as an indicator to check whether the stock is tradable or not. If a stock has low volume traded throughout a period, it implies that there aren’t many people trading that stock.
As a trader/investor, all you want is to get in and out of the market as quickly as possible. If no one is buying/selling security, how come you could trade and profit from it? You should not place orders for stocks traded with low volume.
(Of course, it would not be a problem when trading blue-chip stocks or stocks with the larger market cap.)
4. Resistance or Support?
Often, price level with high volume is deemed as support/resistance level.
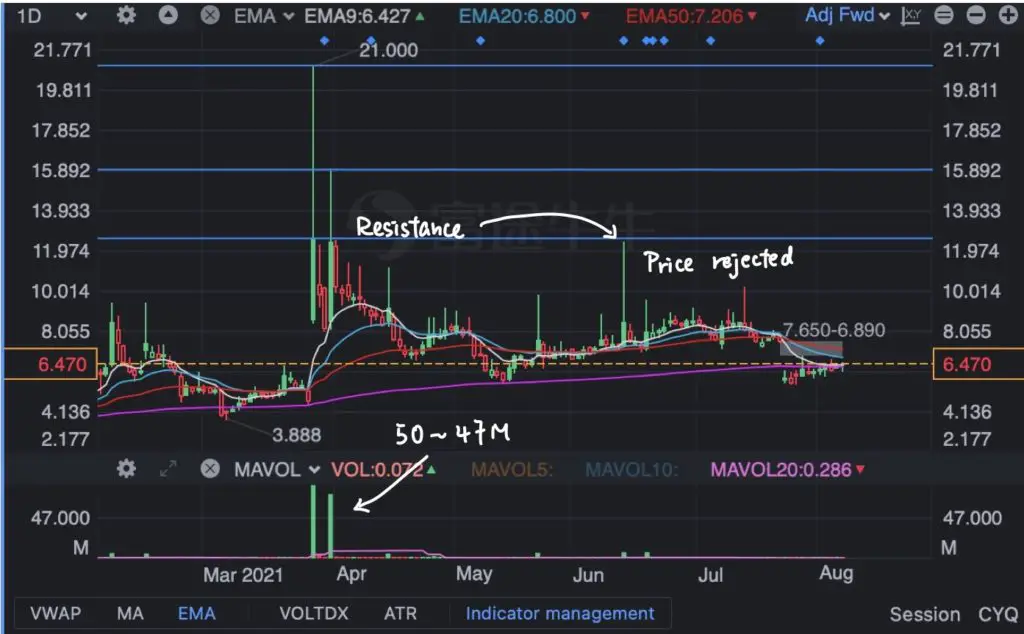
Therefore, next time when you are looking at the chart and drawing resistance and support line, you can look at the price level that has been traded excessively. And, be aware of these price level when you are in a trade.
Little tips: A better and faster way for you to draw the resistance/support line is to draw them at the open/close/high/low of candles with tremendous volume. Just like what I show you in the picture.
Final thought
Volume is a powerful tool when we are trading stocks. Acquiring how to use them allows you to trade with a higher winning percentage.
[Next Lesson: Fundamental Analysis Basics]