
Foreword
Do you know what Price Action and Trends are? When it comes to stock trading, understanding how to react to the market sentiment separates experienced and consistently profitable traders and ordinary traders. In this article, I will walk you through what they are and how you can read the behind message of them.
Price Action
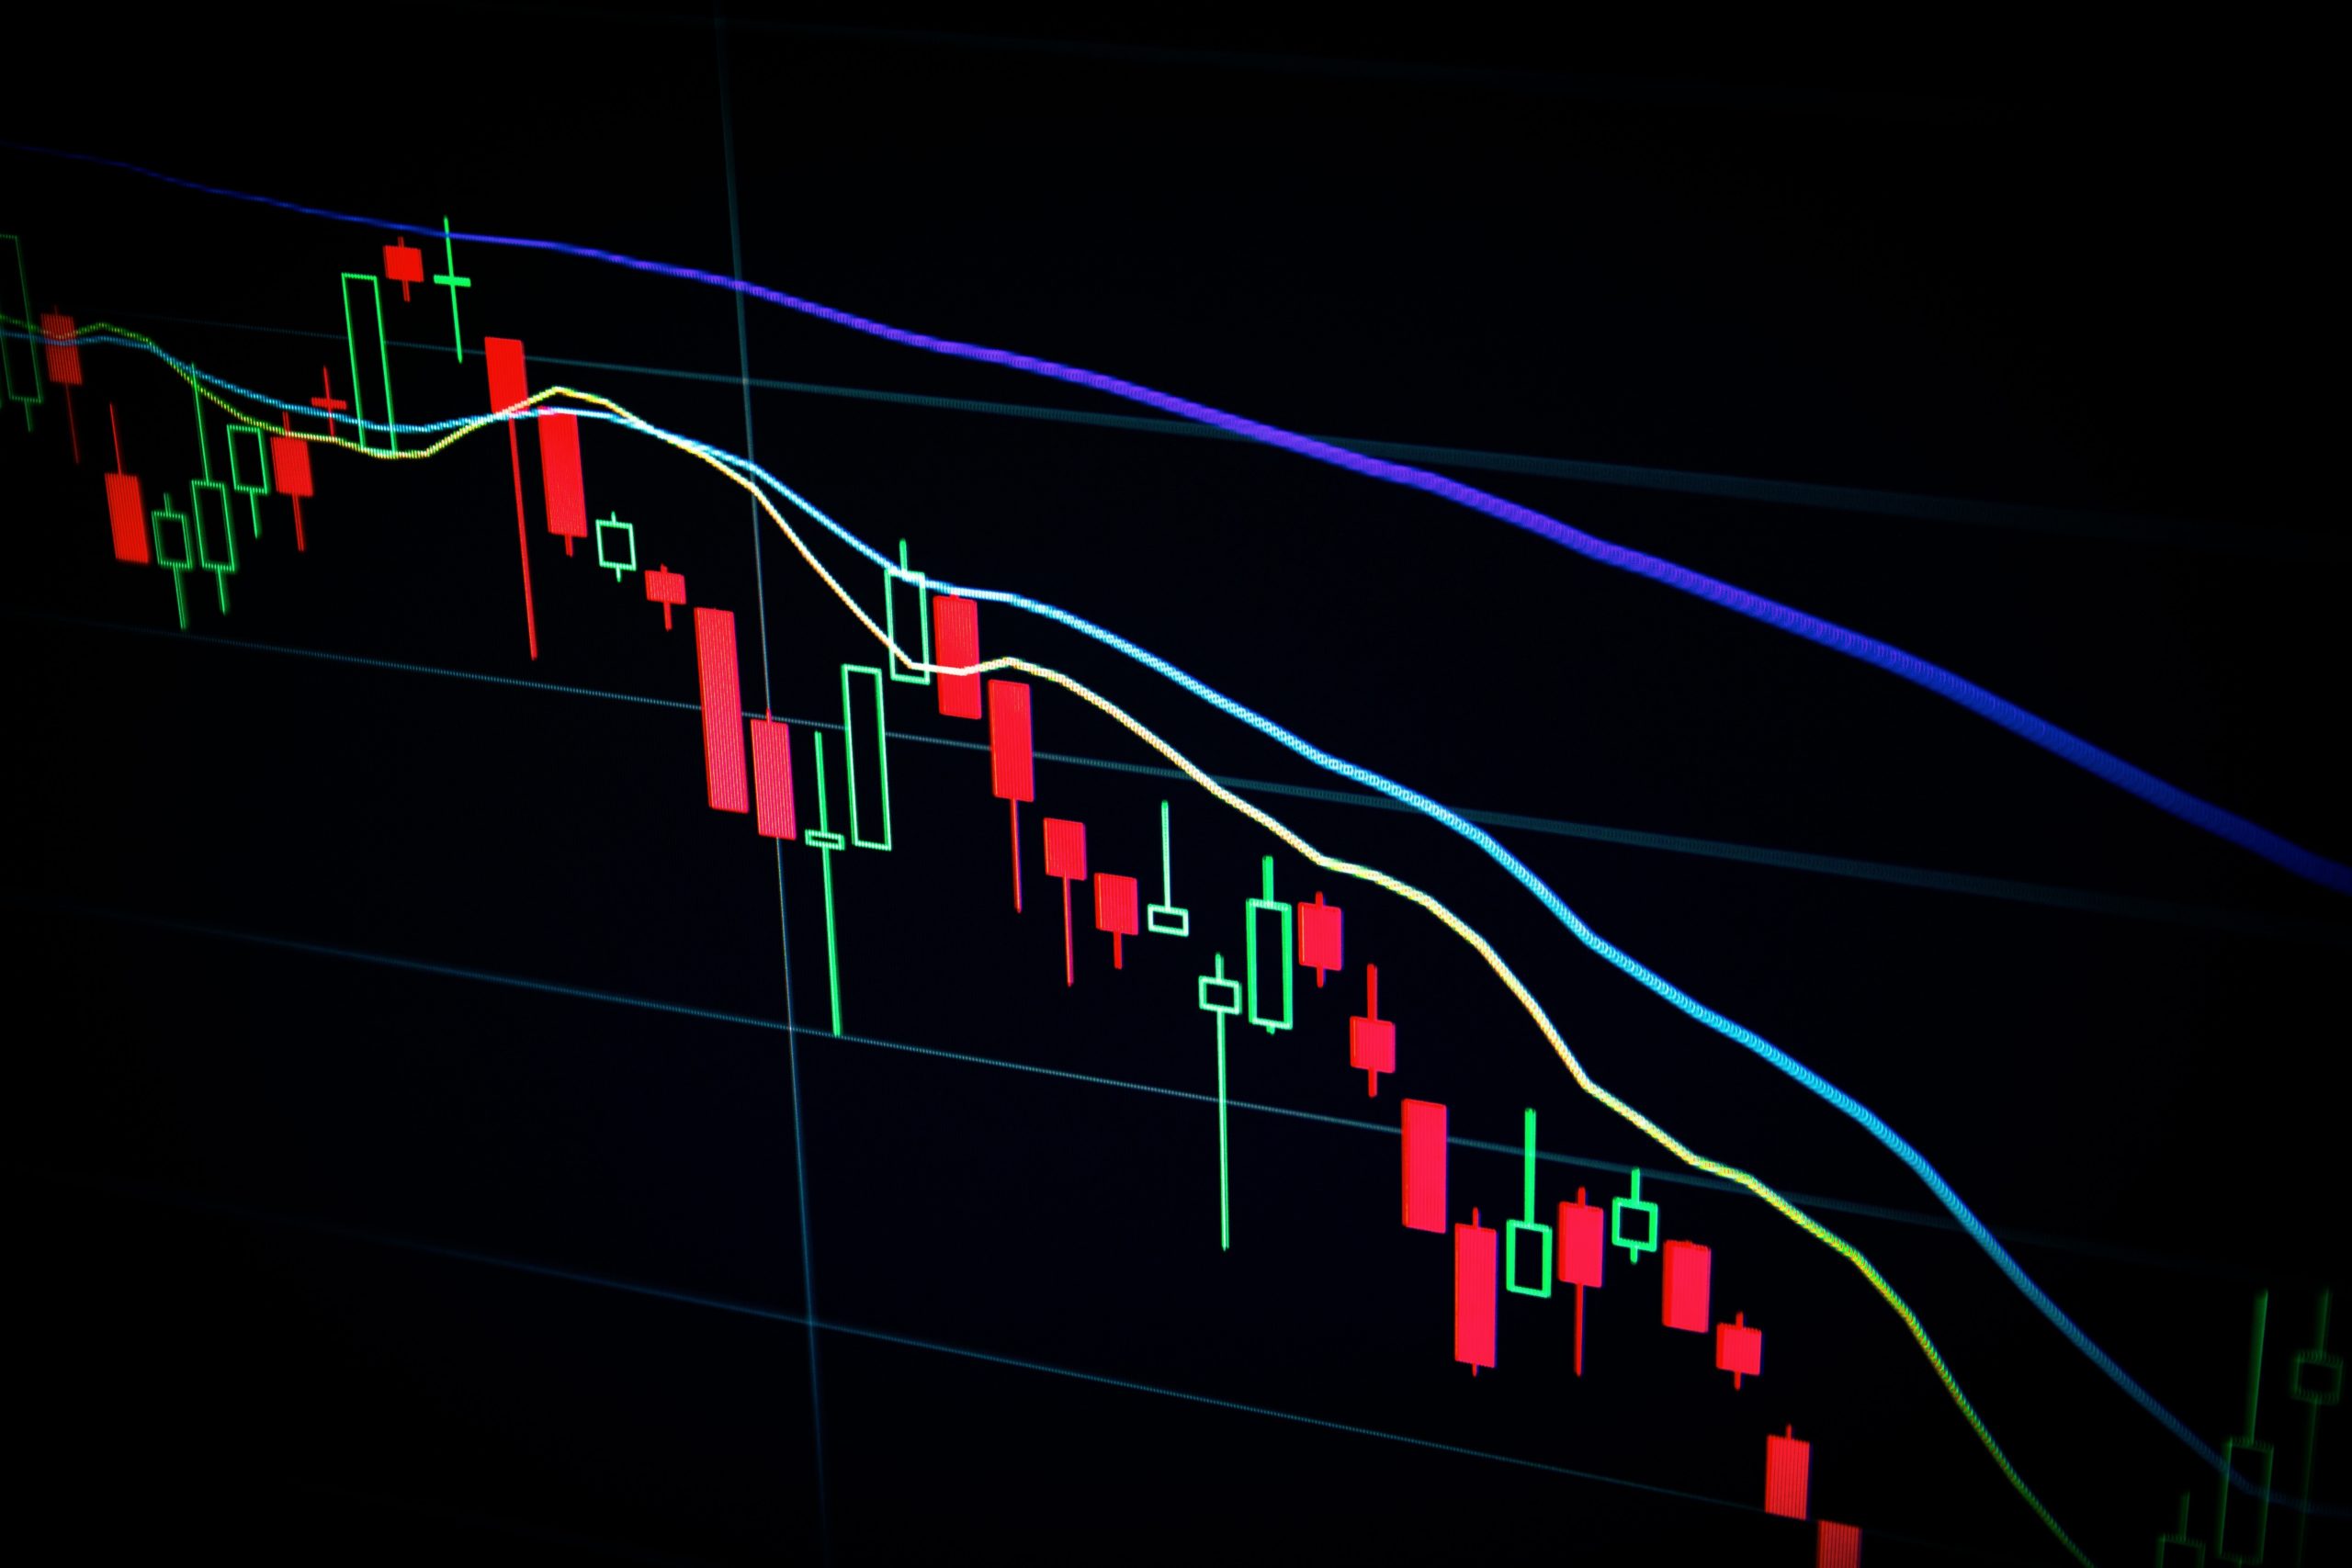
Price Action is the price movement of security plotted over time. Often it is utilized with various chart compositions (a.k.a pattern) for spotting trends, breakouts, and reversal.

To spot trends, breakouts, and reversals, we are to know how these candlestick forms and what they interpret.
1. Big Candles

Formation: When the number of buyers or seller is more than the other one.
Green: Buyer>>Seller (Demand >>Supply)
Red: Seller>>Buyer (Supply >> Demand)
(Big candle implies the trend is strong)
Related article: Supply & Demand = The reason of stock price fluctuation?
2. Dojis

Formation: When both the number of buyers and sellers are nearly the same OR the number of them fluctuate within the timeframe.
(Doji implies there is indecision.)
3. Hammers

Formation: When the number of buyer or seller increases or decreases significantly within the timeframe.
(Hammer implies there is indecision)
Trend:
Trend means direction. Therefore, for security, the trend is the direction of the security price. An uptrend or a downtrend? With the price action and chart compositions (a.k.a pattern), we could determine whether the stock is in strength or weakness and whether there would be trend reversal or not.

Although Doji and hammer mean indecision, reversal of trend may not occur.

Final Thought
Understanding the meaning behind the formation of candlesticks would separate you and ordinary traders. Meanwhile, having the ability to find the timing to jump into the market and making predictions on trend reversal would get you in the way of success.
[Next Lesson: Strengthen & Weakness]